Support justice-driven, accurate and transparent news — make a quick donation to Truthout today!
Reversing the decline in state investment in transportation, public buildings, water treatment systems, and other forms of vital infrastructure is key to creating good jobs and promoting full economic recovery – and this is an especially good time for states to do it.
The condition of roads, bridges, schools, water treatment plants, and other physical assets greatly influences the economy’s ability to function and grow. Commerce requires well-maintained roads, railroads, airports, and ports so that manufacturers can obtain raw materials and parts, and deliver finished products to consumers. Growing communities rely on well-functioning water and sewer systems. State-of-the art schools free from crowding and safety hazards improve educational opportunities for future workers. Every state needs infrastructure improvements that have potential to pay off economically in private sector investment and job growth.
But rather than identifying and making the infrastructure investments that provide the foundation for a strong economy, many states are cutting taxes and offering corporate subsidies in a misguided approach to boosting economic growth. Tax cuts will spur little to no economic growth and take money away from schools, universities, and other public investments essential to producing the talented workforce that businesses need.[1] This pattern of neglect of infrastructure by states – the primary stewards (along with their local government partners) of the nation’s infrastructure – has serious consequences for the nation’s growth and quality of life as roads crumble, school buildings become obsolete, and outdated facilities jeopardize public health.
States should address unmet infrastructure needs now for several reasons:
-
The investment will improve state economies, now and in the future. Higher-quality and more efficient infrastructure will boost productivity in states that make the needed investments, lifting long-term economic growth and wages. In the short term, even though employment is recovering, millions of Americans are working less than they would like and making less than it takes to get by. Key infrastructure investments would provide immediate job opportunities.
-
Opportunities to finance infrastructure investment abound. States often pay for building new schools, roads, airports, water treatment facilities, and the like using debt, a sound practice for financing infrastructure that can serve generations. Today’s historically low interest rates are especially favorable to such borrowing, and state and local debt is below pre-recession levels. States also have many other revenue sources available including user fees like tolls as well as federal grants.
-
States are in a better position to afford these investments than they’ve been in several years. The nation’s economy has slowly recovered from the Great Recession, finally lifting state revenues above pre-recession levels, better enabling states on average to afford infrastructure investments. But in many states, revenues aren’t sufficient to adequately cover the costs of needed services such as education and health care, and still make the necessary infrastructure investments. These states will need to consider tax increases to preserve public capital that is crucial to long-term economic growth while meeting other needs.
A number of states have recognized the historic opportunity and need for infrastructure investments. For example, Connecticut and Washington are in the early stages of multi-year transportation improvement initiatives. Last year, in more than ten states, including Idaho and Georgia, gas tax increases funded road construction.
But overall, states are cutting infrastructure spending as a share of the economy, the opposite of what is needed. Spending by state and local governments on all types of capital dropped from its high of 3 percent of the nation’s Gross Domestic Product (GDP) in the late 1960s to less than 2 percent in 2014. Falling federal spending on infrastructure is exacerbating the problem.
States must turn their attention back to the type of infrastructure investments that will boost productivity, support business growth, create jobs, provide a healthier environment, and improve opportunities for all of their residents. The specific investments needed will differ from state to state depending on factors like the condition of the existing infrastructure and the mix of industries in the region, but states continue to ignore needed investments at the country’s peril.
Investment in Public Infrastructure Is Falling, With Real Consequences
In the decades after World War II, the United States built an interstate highway system, hundreds of airports, a massive network of waterworks, expanded port facilities, and other infrastructure that significantly boosted the country’s economic output. Much of this infrastructure is in dire need of repair. In addition, better functioning infrastructure, including more efficient public transit systems and more environmentally friendly water and sewer systems, could boost economic growth and quality of life. Despite these needs, governments at all levels are failing to make the improvements that the nation’s roads, bridges, and other infrastructure need.
The Nation’s Infrastructure Needs Improvement
Across the United States, years of neglect have resulted in crumbling roads, bridges in need of repair, inadequate public transport, outdated school buildings, and other critical infrastructure needs.
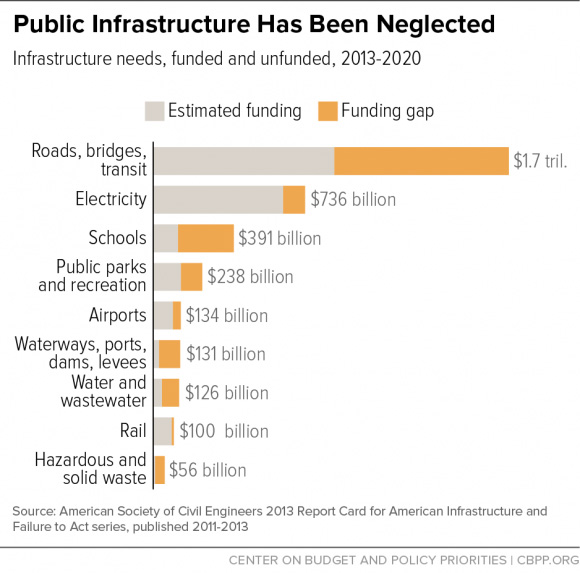
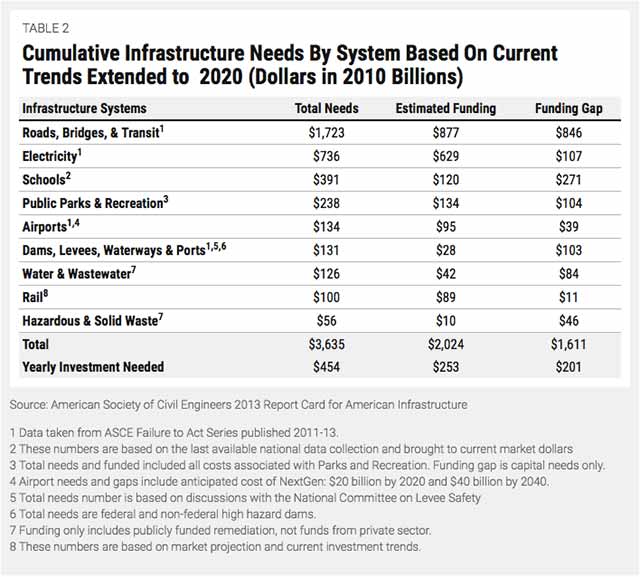
In its most recent report card on the condition of America’s infrastructure, the American Society of Civil Engineers (ASCE) gave US infrastructure a D+ or “poor” rating. The engineers estimated the cost of bringing America’s infrastructure to a state of good repair (a grade of B) by 2020 at $3.6 trillion, of which only about 55 percent has been committed.[2] Improving roads and bridges alone would require almost $850 billion more than states, localities, and the federal government have allocated. Schools need another $270 billion beyond what’s been invested. (See Figure 1 and Table 2 in the Appendix.)

 Other studies have supported and built on the ASCE findings. For instance, America’s drinking water treatment and distribution systems need $384 billion in investments over the next 20 years, according to the Environmental Protection Agency.[3] Over half of America’s public schools need to be repaired, renovated, or modernized according to a US Department of Education survey.[4] And almost 20 percent of the country’s roads are in poor condition, according to the Federal Highway Administration’s most recent survey.[5]
These needs vary significantly by state because of differences in size, congestion, and age of existing infrastructure. For example, 41 percent of the roads in Rhode Island are in poor condition, while only 11 percent of roads in North Carolina are, according to ASCE. Illinois needs $19 billion to improve its drinking water treatment facilities while Georgia – with a population similar to Illinois – needs about half that. The ASCE report card also includes information on state infrastructure needs and investment.[6]
State and Local Governments Are the Primary Stewards of the Country’s Infrastructure
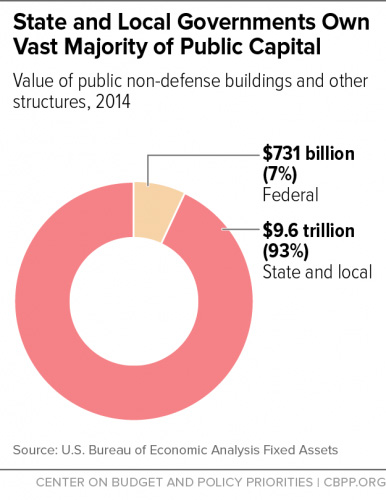
State and local governments are the stewards of most of the country’s public capital.
They own over 90 percent of non-defense public infrastructure assets,[7] and although the federal government assists in the building and maintenance of these assets, state and local governments pay 75 percent of the cost of maintaining and improving them.[8] (See Figure 2.)
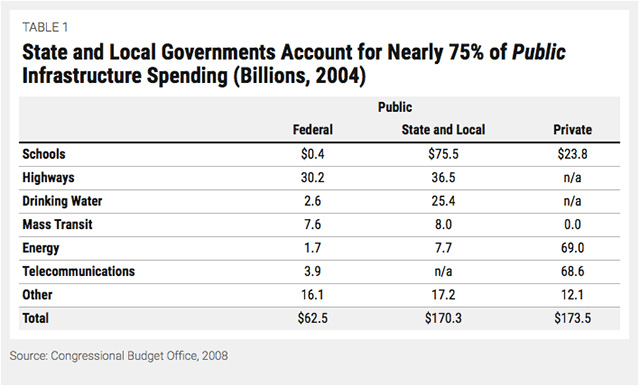
States and localities spend the vast majority of their capital dollars – 9 out of 10 – on key building blocks of a state’s economy: schools, transportation, and drinking water treatment and distribution. (See Table 1.)
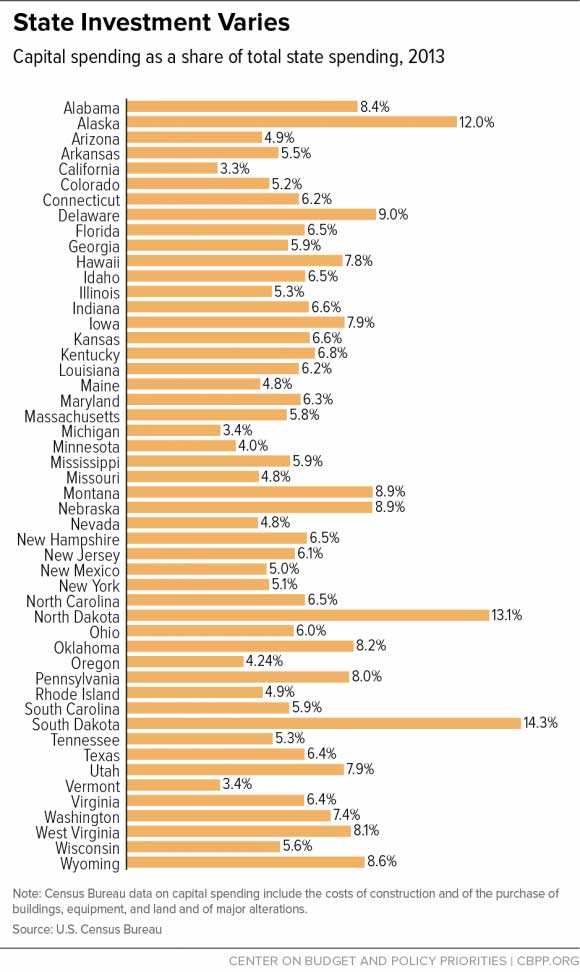
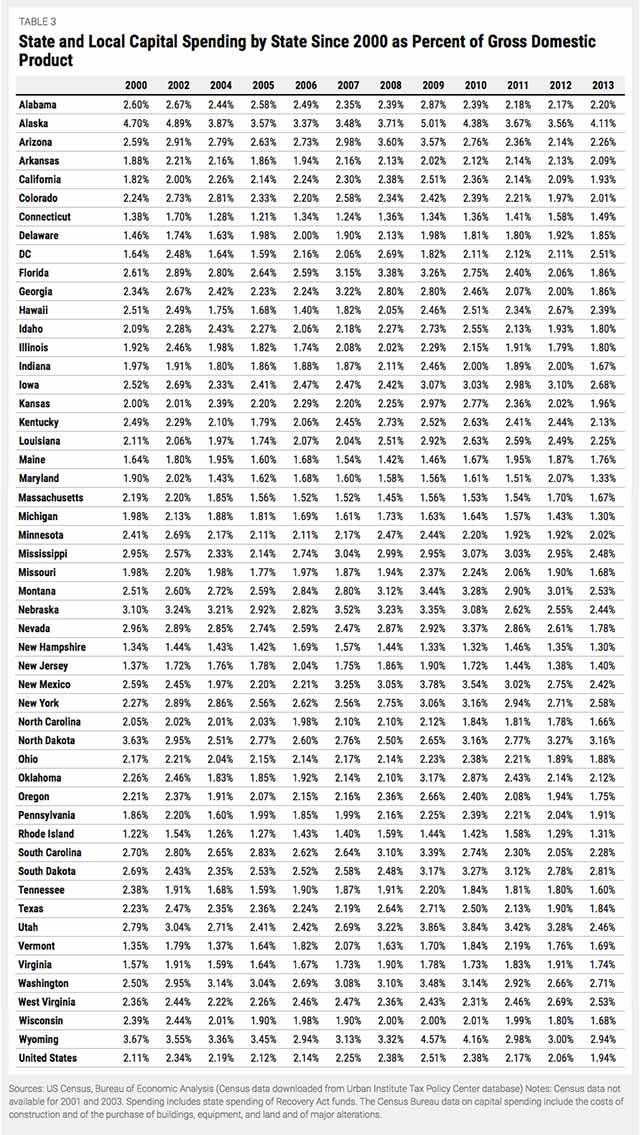
Not surprisingly, current investment varies significantly by state. Figure 3 shows the portion of total state spending devoted to capital spending in 2013. Several large states with small populations – Alaska, North Dakota, and South Dakota – spent over 10 percent of their budget on capital expenses. At the other end of the spectrum, three states – California, Michigan, and Vermont – spent less than 4 percent.
The share of a state’s budget devoted to capital spending can vary based on factors like the size and population density of a state or the age of existing infrastructure. But some differences result from the willingness of the state to identify and fund needed investments. Overall, investments have been declining as needs have risen.
How States Pay for Infrastructure Projects
States pay for public buildings, facilities, roads, and other infrastructure somewhat differently than they fund other types of spending. For example, they use debt more frequently and often rely on user fees like tolls to fund infrastructure. In addition, the federal government provides grants for roads, transit, and other infrastructure. But state revenues are required, regardless of funding method that’s used. Borrowing must be repaid and federal grants often require matching funds.
Borrowing. There are sound reasons why states and localities borrow to pay for infrastructure, rather than use annual tax collections and other revenues. Public buildings, roads, and bridges are used for decades but entail large upfront costs; borrowing enables the state to spread out those costs. As a result, taxpayers who will use the infrastructure in the future help pay for it, which promotes intergenerational equity. Borrowing also makes infrastructure projects more affordable by reducing the pressure on a state’s budget in any given year. On average, states finance 30 percent of their capital spending with bond proceeds.
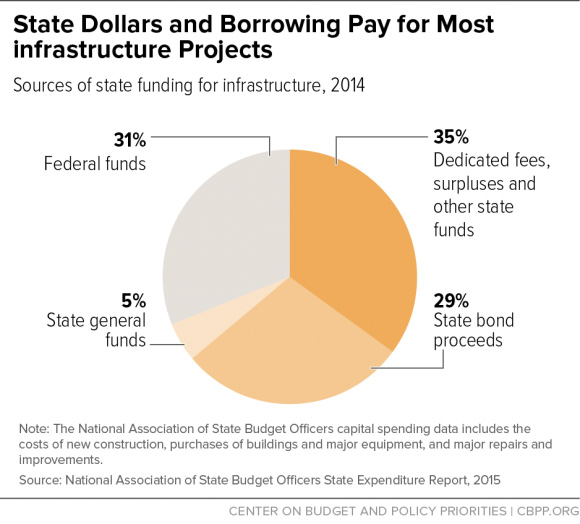
Some states either by law or by tradition do not usually issue general obligation bonds for infrastructure or other spending. Twenty-two states report that they maintain a formal or informal policy of funding infrastructure on a pay-as-you-go basis, according to a recent National Association of State Budget Officers (NASBO) survey. This means they look exclusively or primarily to cash on hand from taxes, fees, grants, or other sources to pay for capital projects. Bond proceeds make up less than 10 percent of funding for capital projects in 19 states.a
Taxes and Fees. On average, states finance only a small share (6 percent) of infrastructure with general fund taxes (typically sales or income taxes not designated for specific purposes).
However, this practice varies by state. States that shy away from borrowing for infrastructure projects depend much more heavily on general fund taxes to pay for building and maintaining infrastructure. General fund spending makes up more than 20 percent of funding for capital projects in seven states – Alaska, Colorado, Indiana, Missouri, New Jersey, North Dakota, and Wyoming.
More typically, the general fund share is small and other state funds make up over a third of funding for capital projects. This includes taxes designated for infrastructure such as gas taxes or user fees like tolls, water and sewer fees, or facility entry fees.
Grants. The federal government is an active partner with states in building and maintaining infrastructure. States use federal grants to pay for some 30 percent of their infrastructure spending. The federal government provides grants for road and public transit projects, for utilities, and a host of other capital expenditures.
Public/Private Partnerships. In addition, the private sector sometimes partners with states and localities to jointly fund a needed infrastructure project. Or, in some cases, the private sector builds or maintains a road or a public facility in return for collecting tolls or other user fees associated with the facility. (Any state spending related to public/private partnerships is not identified separately by NASBO in the chart above.)
a National Association of State Budget Officers, “Capital Budgeting in the States,” Spring 2014.
b National Association of State Budget Officers, “State Expenditure Report,” 2015.
Infrastructure Spending Is Down Across Government
Federal infrastructure investment has fallen by half – from 1 percent to 0.5 percent of GDP – over the last 35 years, leaving more of the task to state and local governments.[9] For example, federal spending on transportation and water infrastructure has fallen in real terms since 2003, and the federal gas tax has not been increased since 1992. The recently passed five-year federal transportation bill falls short of providing the amount needed to maintain and expand the nation’s road system. And even the new investments in that bill will be at risk in future years because they are paid for with cuts in other parts of the budget, rather than an increase in the gas tax.
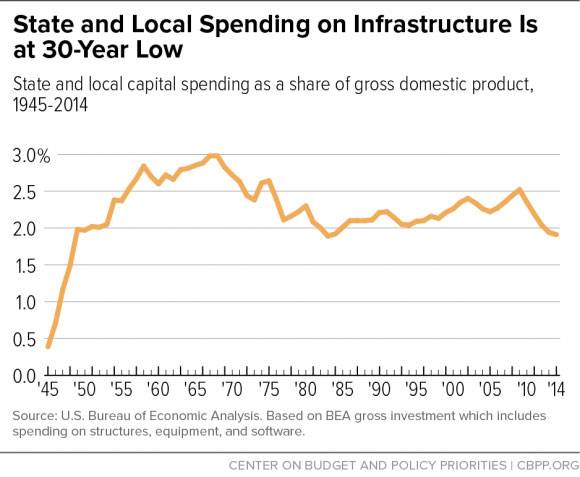
In the 1990s, when the economy was particularly strong, states and localities increased their investments. But this trend ended after the turn of the century, except for a temporary boost fueled by federal infrastructure funding to states and localities from the 2009 Recovery Act. Spending by state and local governments on all types of capital fell from 2.4 percent of GDP in the early 2000s to 1.9 percent in 2014.[10] (See Figure 4.)
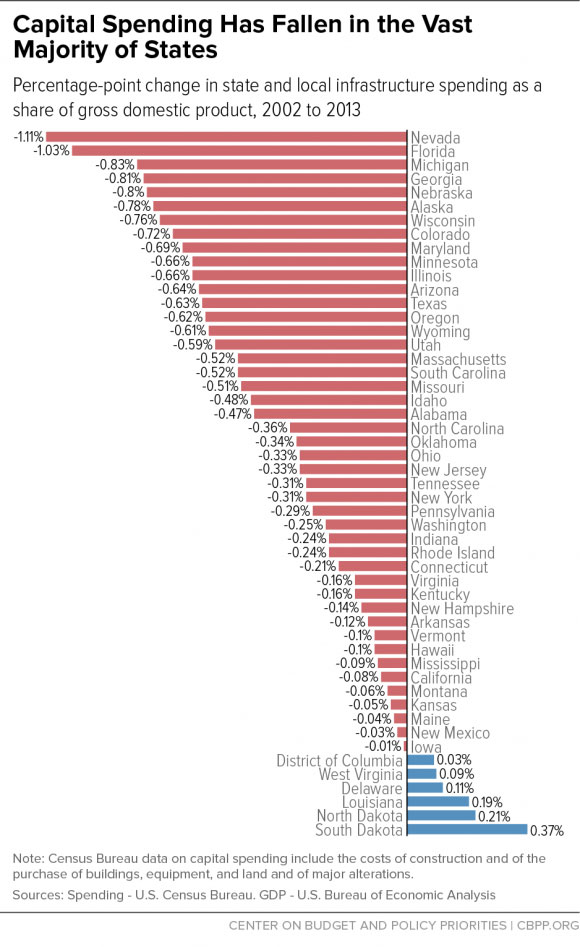
Total capital spending as a share of state GDP fell in all but five states and the District of Columbia between 2002 and 2013, with the largest drops in Nevada, Florida, and Michigan. These states’ revenues were hit particularly hard by the Great Recession, resulting in cuts in all parts of the budget, especially after the federal Recovery Act funds were depleted. But capital spending has not bounced back in these states – or most others – even as the economy has recovered. (See Figure 5.)
Investment in Public Infrastructure Fuels Economic Growth
The condition of roads, bridges, schools, water treatment plants, and other physical assets greatly affects the economy’s ability to function and grow. Commerce requires well-maintained roads, railroads, airports, and ports so that manufacturers can obtain raw materials and parts, and deliver finished products to consumers. Improving many types of public infrastructure boosts the productivity of businesses by reducing their costs. Growing communities rely on well-functioning water and sewer systems. State-of-the art schools free from crowding and safety hazards improve educational opportunities for future workers. Better roads and public transit make it feasible (or more efficient) for workers to get from their home communities to more of the places where the jobs are. Carefully targeted initiatives to maintain and improve public infrastructure boosts a state’s long-term productivity, resulting in more economic growth and higher-wage jobs. In the short-term, under the right conditions – including the current ones – public infrastructure investments also can create needed jobs.
Well-Targeted Public Investment in Infrastructure Improves Private Productivity, Research Shows
Recent research has found that infrastructure investments generally result in a more productive economy, which typically means higher wages and a better quality of life.
The interactions between public infrastructure investments and private sector growth are, however, highly complex and difficult to quantify. A groundbreaking 1989 analysis by economist David Aschauer of the country’s economic and public infrastructure growth between 1949 and 1985 found that a 10 percent increase in public sector capital stock (such as roads, transit, and public buildings) increased productivity growth by almost 4 percent.[11] Some researchers, skeptical of this finding, conducted studies using different data sets and methods. These initial reports found considerably smaller effects than the early work or no effect at all.[12]
Many subsequent studies of this question have been conducted using US and international data. On balance, studies conducted between the late 1990s and 2007 tended to confirm a relationship between public infrastructure investment and economic growth. “…Although not all studies find a growth-enhancing effect of public capital, there is more of a consensus in the recent literature than in the older literature…” a 2007 survey of over 75 studies of the relationship concluded.[13]
The search for ways to restore economic growth following the 2008 recession prompted additional research on this topic. Many of these more recent studies found that spending on public infrastructure has a positive and statistically significant effect on productivity and, thus, economic growth.[14] Although the magnitude of the effects found in individual studies differed, the general findings of the most recent studies is that an increase in the value of existing current capital stock (roads, bridges, and other infrastructure) would increase productivity growth. The effects are about half as large as those Aschauer initially estimated.[15]
Economists prepared a number of estimates of the impact of an additional dollar of infrastructure spending on GDP growth in 2008 during the debate over a federal fiscal stimulus package. These estimates found that in the depths of the Great Recession, a dollar in infrastructure investment would result in $1.50 in GDP growth, according to the Council of Economic Advisers.[16] Similarly, Moody’s, a leading private econometric firm, estimated the effect at $1.60.[17] The Congressional Budget Office found that that the impact ranged from a low estimate of $1.00 to 2.50.[18]
This impact will be less but likely still positive during a time of economic growth, when there is still some slack in the labor market – as in the economy now. Moody’s estimated that as of the beginning of 2015, after a number of years of economic recovery, an additional dollar of infrastructure investment would increase GDP by $0.86. That effect shrinks the closer the economy is to full employment.
Other key points for state policymakers to keep in mind include:
-
A portion of the economic benefits may spill over into neighboring states. The majority of the studies of the effects of infrastructure investment focus on national spending, but some have looked specifically at the effect of infrastructure spending in US states or cities.[19] Generally, the effect of state infrastructure spending on economic growth was found to be different – often somewhat smaller – than the effect of federal spending because of something called the “spillover” effect. That is, the benefits of improving the roads or other infrastructure of one state may spill over to neighboring states and improve commerce in both states. Because of the spillover effect, state investments have a larger impact on national economic growth than on growth in the individual state making the investment. And, somewhat paradoxically, failing to account for these spillover effects in economic models can lead to an artificially low estimate of the overall effect of state capital spending.[20]
-
The size of the impact may vary by region. Not surprisingly, a number of studies on the differences among countries find that the largest positive effects occur in places where the quality and quality of infrastructure lags.[21] The same would hold true within the United States. Regions that have underinvested in infrastructure historically are thus ones where increased investments could have the largest payoffs.
-
States need to evaluate the tradeoffs. State policymakers will need to prioritize infrastructure projects and weigh their value against other state needs. Since states generally have so underinvested in their infrastructure, there’s little question that they can identify affordable projects that will boost productivity over time.[22] At the same time, many states have also neglected to invest properly in their residents’ education, health, and quality of life. In some cases, states will need to raise revenue to meet these various needs, and all states will need to evaluate the tradeoffs involved in choosing various investments over others. In addition, some revenue sources often used to finance infrastructure, such as tolls, fall more heavily on low-income taxpayers. States may choose to avoid these sorts of financing options for this reason, or consider ways to offset the negative effects such as by enacting or expanding targeted tax credits like the Earned Income Tax Credit.
Public Infrastructure Investment Can Spur Job Growth
Under the right conditions, investment in infrastructure boosts employment as soon as building begins, with large public construction projects generating hundreds of well-paying jobs. Many of the new jobs last only as long as the project is being constructed, but for major projects they can last for multiple years. Plus, other jobs will be needed to maintain the structures once they have been built, extending the project’s job-creation impact.
This job creation has the greatest impact on state economies when, as there is now, there’s slack in the economy and unemployed or underemployed workers are available to fill these jobs. The Labor Department’s most comprehensive measure of unemployment – which includes people who want to work but are discouraged from looking and those working part-time because they can’t find full time jobs – remains at 9.9 percent, above pre-recession levels. The jobs created, mainly in fields like construction, tend to pay middle or high wages so they can boost workers’ standard of living.[23]
When there are readily available workers, projects that bring an influx of new money into a state because they are funded with federal dollars or through borrowing – as most state infrastructure projects are – can be particularly effective at boosting employment and earnings. On the other hand, if the state raises taxes or cuts other spending to pay for some or all of the project at the outset, the impact on a state’s employment would be smaller but likely still positive, especially if the taxes raised are those paid by high-income individuals or businesses. If their taxes were lower, businesses or individuals might otherwise save that money or spend it outside the state. But if these dollars are instead used to pay for a public construction project, a significant portion goes to in-state workers, improving the local economy as workers spend their paychecks in the area. Materials and equipment purchased from in-state companies would have a similar effect.
State infrastructure projects may leverage private funds as well, adding to the economic benefits. (See the discussion of the various funding methods in the box above.)
Investment in Public Infrastructure Can Improve a State’s Quality of Life, the Environment and Opportunity
On top of the economic benefits, well-designed investments in parks, libraries, schools, and better roads and public transit can improve residents’ quality of life. There are also a host of ways to improve the country’s environment with investments in “green” technology for waste treatment, energy production, and public transit.
Improved Quality of Life
New and improved public amenities can bring less tangible but very real benefits to state residents. For example, a community is improved in ways that may be difficult to measure when children are taught in up-to-date and uncrowded schools that provide the latest technology as well as good athletic and arts facilities. These sorts of investments can expand the opportunities available to children and enhance their learning experiences.[24] An area’s quality of life also increases when people have easy access to modern libraries and well-designed and maintained parks. And well-maintained roads, bridges, and public transit that make commutes smoother improve both commerce and quality of life.
A Better Environment
Many types of public infrastructure play a major role in maintaining and improving the country’s environment. Fully one-quarter of the country’s non-defense public capital directly affects the environment, with water and sewer plants, conservation and recreation facilities, and power plants making up 11 percent, 6.5 percent, and 3 percent of non-defense public capital, respectively. Transportation other than roads accounts for another 6.5 percent of non-defense public capital.[25]
States can improve their local and regional environment by carefully designing new power plants, public transit, and water and sewer treatment facilities. These benefits to the state and region are very real even if they do not always show up in typical measurements of economic growth and productivity that are studied in the research on the impact of infrastructure. A cleaner environment can improve the health of residents and increase quality of life by providing places for recreation and wildlife.
Improved Opportunity for All
A major reason for public (as opposed to private) investment in infrastructure is to ensure that people of all income levels have access to amenities like good roads, schools, and hospitals. When an investment’s benefits are so spread out over time and place that it is not feasible to profit from them, the private sector cannot be relied upon to provide those investments. Rather, it is up to government at all levels to ensure equal access.
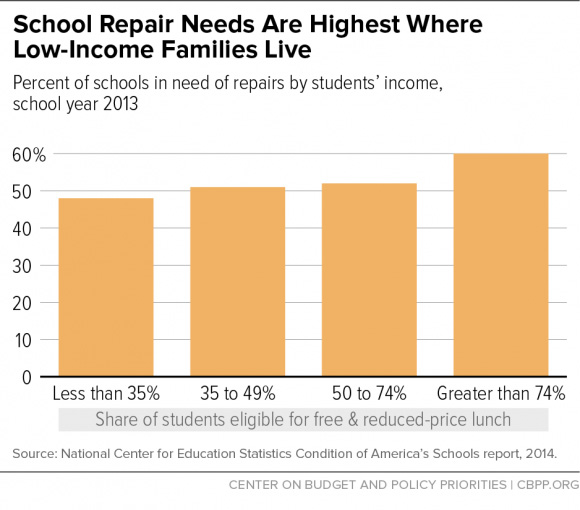
But even when the public sector plays the leading role in providing for an asset such as elementary and secondary schools, inequities can arise. For example, a higher percentage of public schools in poor areas are in need of repair than those in the wealthiest places. (See Figure 6.) Part of the reason for this is that schools are often funded by local property taxes and property values are lower in poor areas.
In addition, poorer areas are often home to outdated infrastructure beyond schools. For example, aging lead water pipes are much more common in the lowest-income neighborhoods or cities. This brings the potential for dire health problems and the associated health and economic costs, as the experience of Flint, Michigan, has demonstrated.[26] Increased investment by states that is targeted to low-income areas can help address these problems.
It’s Time for States to Invest More in Infrastructure
With the memory of the Great Recession still fresh, some states and localities are hesitant to take on more debt, despite their extensive infrastructure needs. That’s a mistake, in part because conditions for borrowing have rarely been better.
-
States’ and localities’ current interest costs are low. Interest payments on debt averaged just 4 percent of current spending in 2013, the lowest level since Census began tracking this data in 1977. Interest payments made up less than 5 percent of state and local spending in all but nine states.[27]
-
Total state and local debt is below pre-recession levels. Measured as a share of the economy, state and local debt has fallen since 2009 and is below pre-recession levels. If borrowing returned to pre-recession levels as a share of the economy, an additional $400 billion would be available, with which states and localities could address infrastructure needs. (For comparison, the aggregate value of all bonds issued for school construction and rehabilitation between 2003 and 2012 was $514 billion.)
-
Borrowing is inexpensive. The Federal Reserve has kept the short-term interest rate that banks charge to borrow from each other very low. This, in turn, has kept the interest rates charged for other types of loans, including bonds purchased from state and local governments, low as well.[28] Although the Federal Reserve has begun raising short-term interest rates the Congressional Budget Office projects that interest rates will rise only slowly.[29]
-
The federal government subsidizes state and local borrowing. The federal government provides that interest from investments in state and local government bonds are exempt from federal income taxes. The federal tax exemption effectively subsidizes state and local infrastructure projects, since states and localities otherwise would need to pay bond investors a higher interest rate. While Congress may consider in the near future a tax reform package that alters somewhat this tax exemption, it is highly likely that the federal government will continue to provide substantial subsidies for state and local bond investments.
State economies are finally recovering from the Great Recession. As the nation’s economy has slowly recovered, overall state revenues have exceeded their pre-recession levels, better enabling states on average to afford infrastructure investments. But in many states revenues still aren’t sufficient to adequately cover the costs of needed services such education, health care, and infrastructure investments so some states will need to consider tax increases to preserve the public capital that is crucial to long-term economic growth. And revenue collections remain below historic averages as a share of the economy in many states, suggesting that there is room for tax increases for important investments in roads, public transit, schools, and other infrastructure.
End Notes:
[1] For example, see: Michael Leachman and Michael Mazerov, “State Personal Income Tax Cuts: Still a Poor Strategy for Economic Growth,” Center on Budget and Policy Priorities, updated May 14, 2015, https://www.cbpp.org/research/state-budget-and-tax/state-personal-income-tax-cuts-still-a-poor-strategy-for-economic.
[2] 2013 Report Card for America’s Infrastructure, American Society of Civil Engineers, March 2013,https://www.infrastructurereportcard.org/.
[3] Drinking Water Infrastructure Needs Survey and Assessment, US Environmental Protection Agency, April 2013.
[4] Condition of America’s Public School facilities: 2012-13, US Department of Education, NCES 2014-022, March 2014.
[5] US Department of Transportation, Office of the Assistant Secretary for Research and Technology, Bureau of Transportation Statistics, State Transportation Statistics 2015, Table 1-7.
[6] American Society of Civil Engineers, 2013. State-specific report cards are also prepared but the release schedule varies.
The “Sources” for the state information on the ASCE website include links to state-by-state data from various sources. https://www.infrastructurereportcard.org/a/#p/state-facts/sources
[7] CBPP calculations of Bureau of Economic Analysis data on Fixed Assets, 2014.
[8] Statement of Peter R. Orszag, Director, Congressional Budget Office before the Committee on Finance, United States Senate, “Investing in Infrastructure,” July 10, 2008; CBPP calculations of data in Table 1.
[9] Jared Bernstein, “I (mostly) like Hillary’s Infrastructure Plan,” Washington Post, December 2, 2015.
[10] CBPP analysis of Census Government of Finances and Bureau of Economic Analysis data.
[11] David Aschauer, “Is Public Expenditure Productive?” Journal of Monetary Economics, Vol. 23, 177-200, 1989.
[12] See for example: Alicia Munnell, “Infrastructure investment and economic growth,” Journal of Economic Perspectives, Vol 6 (4), 189-98 1992; and Douglas Holtz-Eakin, “Public-Sector Capital and the Productivity Puzzle,” The Review of Economics and Statistics, Vol. 76 (1), 12-21; and Teresa Garcia-Mila, Therese McGuire, and Robert Porter, The Effect of Public Capital in State-Level Production Functions reconsidered, Review of Economics and Statistics, Vol 78 (1), 177-180.
[13] Ward Romp and Jakob de Haan, “Public Capital and Economic Growth: A Critical Survey,” Perspektiven der Wirtschartspolitik, Vol. 8, 6-52, 2007.
[14] James Heintz, “The impact of public capital on the US private economy: new evidence and analysis,”International Review of Applied Economics, Vol 24(5), 619-632, 2010. Also see Jeffrey Thompson, “Prioritizing Approaches to Economic Development in New England: Skills, Infrastructure, and Tax Incentives,” Political Economy Research Institute, University of Massachusetts, Amherst, August 2010 for a summary of recent articles.
[15] Thompson, 2010. Some of the differing results can be explained by the different econometric methods used, but much of this variation likely results from the fact that these studies focused on different geographic regions, different types of infrastructure, or different levels of government.
[16] Christina Romer and Jared Bernstein, “The Job Impact of The American Recovery and Reinvestment Plan,” Council of Economic Advisers, January 9, 2009.
[17] Moody’s Analytics, cited in Alan S. Blinder and Mark Zandi, “The Financial Crisis: Lessons for the Next One,” Center on Budget and Policy Priorities, October 15, 2015, https://www.cbpp.org/research/economy/the-financial-crisis-lessons-for-the-next-one.
[18] Congressional Budget Office, “Estimated Impact of the American Recovery and Reinvestment Act on Employment and Economic Output,” April 2010-June 2010.
[19] For example, Donald Bruce, et al., “Road to Ruin? A Spatial Analysis of State Highway Spending,” Public Budgeting & Finance, Winter 2007, 66-85; Andrew Haughwout, “Public Infrastructure Investments, Productivity and Welfare in Fixed Geographic Areas,” Journal of Public Economics, Vol. 83, 2002, 405-425; and Alicia Munnell, “Infrastructure investment and economics growth,” Journal of Economic Perspectives, Vol. 6, No. 4, 1992, 189-98.
[20] Jeffrey P. Cohen, and Catherine Morrison Paul, “Public Infrastructure Investment, Interstate Spillovers, and Manufacturing Costs,” The Review of Economics and Statistics, Vol. 86, No. 2, 2004, 551-560.
[21] Romp and de Haan, 2007.
[22] The value to a state of different types of infrastructure investment will vary based on many factors including the expected impact on economic growth but this can be difficult to quantify. For example, a number of studies find that spending on transportation is effective at boosting economic growth and include estimates of the impact of a dollar of increased spending on GDP growth. But the magnitude of the effects of investment in other specific types of infrastructure is less clear, results are more mixed, and magnitudes vary. One explanation for the lack of consensus is that it is more difficult to measure the quality of educational or health care facilities, for example. In addition, these sorts of investments’ benefits may be difficult to quantify because they occur years in the future or because improvements in quality of life or the environment are less tangible.
[23] Josh Bivens, “The Short and Long Term Impact of Infrastructure Investments on Employment and Economic Activity in the US Economy,” Economic Policy Institute, July 1, 2014.
[24] “Impact of Inadequate School Buildings on Learning,” US Department of Education, April 3, 2000, https://www2.ed.gov/offices/OESE/archives/inits/construction/impact2.html; “Green Schools Are Better for Learning,” Center for Green Schools, June 30, 2015, https://www.centerforgreenschools.org/green-schools-are-better-learning.
[25] James Heintz, “The impact of public capital on the US private economy: new evidence and analysis,”International Review of Applied Economics, Vol. 24, No. 5, 2010, 619-632.
[26] Abby Goodnough, Monica Davey, and Mitch Smith, “When the Water Turned Brown,” New York Times, January 23, 2016, https://www.nytimes.com/2016/01/24/us/when-the-water-turned-brown.html?_r=0.
[27] CBPP calculations of Census of Government Finances data.
[28] For further discussion of state debt, see: “Policy Basics: State and Local Borrowing,” Center on Budget and Policy Priorities, January 15, 2015, https://www.cbpp.org/research/policy-basics-state-and-local-borrowing.
[29] Congressional Budget Office, “The Budget and Economic Outlook, 2016-2026,” January 25, 2016, https://www.cbo.gov/publication/51129.
Media that fights fascism
Truthout is funded almost entirely by readers — that’s why we can speak truth to power and cut against the mainstream narrative. But independent journalists at Truthout face mounting political repression under Trump.
We rely on your support to survive McCarthyist censorship. Please make a tax-deductible one-time or monthly donation.