Support justice-driven, accurate and transparent news — make a quick donation to Truthout today!
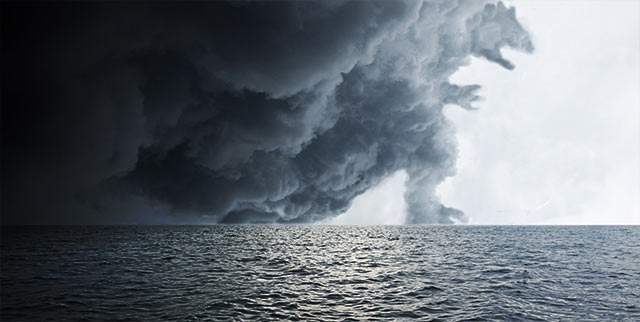
With our planet’s temperature baseline ever rising, it is only a matter of time before we experience global weather patterns of outrageous proportion. The warmer it gets, the greater the risks become. Warmer temperatures add energy to earth’s environmental systems creating extremes that far outpace the temperature increase because of feedbacks.
About 90 percent of heat generated from greenhouse gases is absorbed by our oceans.
Because ocean currents are driven by winds, earth’s spin and unequal heating between the equator and the poles, heat is buried as warm surface water currents are obstructed and driven into the abyss. As warm water is buried, cold deep water surfaces in other areas.
It is this complicated interplay of winds, currents, density, gravity and changing wind structure on a warming planet that is quite likely interacting with ocean currents worldwide and changing the way our planet’s climate behaves.
 Unprecedented warming across huge expanses of the Pacific Ocean. But is this just another meaningless coincidence of nature?
Los Niños
In 1998, we had what the experts call a Super El Niño. El Niño (warm phase) and La Niña (cool phase) are currently recognized as the most impactful of ocean cycles, with impacts arising across the globe.
The ’98 Super El Niño was bigger than anything ever recorded and it caused a spike in earth’s temperature of about 0.17 degrees. This spike was a full 25 percent of all warming we have experienced globally since the turn of the 20th century. Now we have a new Super El Niño and this one is bigger than in 1998.
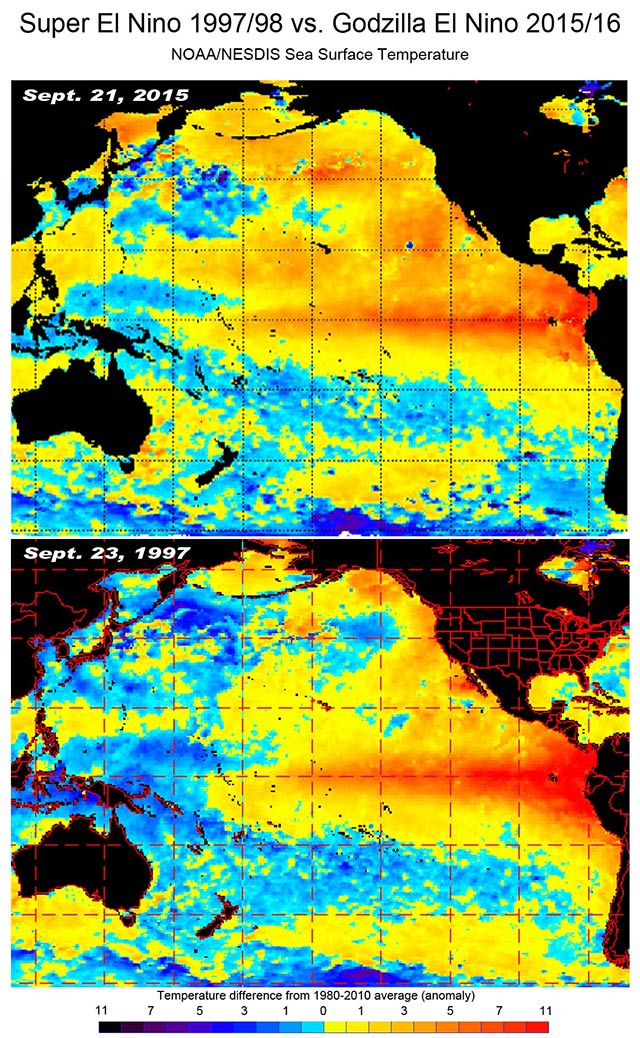 Comparing the Super El Niño to the Godzilla Niño, in just the equatorial region, Super El Niño in 1997/98 could be a bit larger, but the next image below compares sea surface elevation. This additional metric is another indication of Niño strength and plainly shows Godzilla to be the king of Los Niños. What sea surface height does not show is the widespread significantly abnormal warmth across the North Pacific in the image above. This is “the Blob,” as scientists are calling it. It is probably associated with a decades-long warm/cool North Pacific Ocean cycle called the Pacific Decadal Oscillation and it too is unlike anything we have ever seen.
Scientists are calling the developing, and in some cases already unprecedented, El Niño the Godzilla El Niño. (1) Current projections of a record-setting El Niño would be bad enough – except what other scientists are calling “the Blob” will be involved as well. The Blob is unprecedented warmth in the North Pacific. At the least, we are very likely in for a big new global temperature record.
An El Niño advisory continues in effect with a 95 percent certainty it will persist through the spring. The average surface temperature in the El Niño region of the equatorial and South Pacific continues to be above the 2 degrees Celsius warmer than average criteria for a strong El Niño. (2)
 NASA Sea Surface Height: The current Godzilla Niño is significantly more extreme than the Super El Niño of 1997/98 as is shown by this image of sea surface height from NASA satellites. El Niño exhibits a characteristic increase in sea surface elevation that is not interpreted as easily with the North Pacific warming. These images were made with the Topex/Poseidon and Jason-2 gravity measuring satellites. Click on the image above to see a side-by-side animation of the evolution of the 1997/98 Super Niño and the evolution to date of the current Godzilla Niño.
The Blob – Pacific Decadal Oscillation
The North Pacific warm/cool natural ocean cycle is called the Pacific Decadal Oscillation (PDO). It covers most of the North Pacific, lasts for 10 to 30 years, has been in the cool (positive) phase since the late 1990s and appears to have now switched to its warm (negative) phase. These two major ocean cycles (Niño and PDO) have significant influence on global weather in many ways, including influencing not only floods, extreme weather and drought, but by actually cooling or warming the entire atmosphere with heat transfer either too or from the oceans.
 This graphic is from one of our important ice scientists, Jason Amundson, and his Physics 645 class. It helps our understanding of the different phases of the Pacific Decadal Oscillation and El Niño and La Niña, the ocean temperatures involved, their location and how wind is significantly involved. Colors are temperature change in degrees Celsius and arrows are winds. (Credit: Jason Amundson – Physics 645 – Fall 2003 / Image Source: Mantua, 2000)
The PDO joined the ranks of 1960s Eastern sci-fi entertainment in June 2014 when Nicholas Bond of the University of Washington coined the term “The Blob” to represent an uncharacteristic area of warming in the eastern North Pacific. (3) Bond says: “This is a taste of what the ocean will be like in future decades … It wasn’t caused by global warming, but it’s producing conditions that we think are going to be more common with global warming.” (4)
The Blob doesn’t fit the definition of the PDO, however. Temperatures now are warmer and cover more of the North Pacific than is typical. Look at the graphic above titled “Godzilla Science.” Normally, when the PDO is positive, most of the North Pacific is cooler than normal with the exception of the far eastern areas near North America. This has been the condition of the PDO since the late 1990s and like its cousin La Niña’s cool equatorial and South Pacific surface waters, the phases of these currents cool our global atmosphere (among other things). This is where “hiatus” comes in, but more confusion awaits with the PDO first.
The positive mode of the PDO also means high pressures in the far eastern North Pacific abutting North America. This is really important in El Niño years. The high pressures, from warmer than usual ocean waters, cause impacts from El Niño to be enhanced, creating even more extreme floods (or drought) than El Niño alone is responsible for. (5)
Toby Garfield, director of the Environmental Research Division at the National Oceanic and Atmospheric Administration’s (NOAA) Southwest Fisheries Science Center, says the Blob could be a switch to a positive PDO phase, or it could be something happening due to the onset of El Niño. (6)
The “Hiatus”
Not only has the North Pacific been in its cool phase since the late 1990s, but the El Niño/La Niña cycle has largely been in the “cool” La Niña phase during this period as well. It is the cool phases of these two mega ocean current cycles that have largely held down global temperatures since 1998 and created the apparent “hiatus” of global warming. (7)
 Beginning in 1998, it appears that the global temperature has gone on hiatus, that is, that global warming has ceased or slowed. At least, this is what the climate change counter-movement would have us believe.
This so-called hiatus, or pause in global warming, is nothing that humans have caused. Even though greenhouse gas emissions continue to increase faster than ever before, the actual thermometer record shows a pause. This is very confusing to most and a fantastic boon for the $900 million per year climate change counter-movement, which persistently states that earth stopped warming in 1998. (8)
The warming must be going somewhere, and it is. It is being masked by massive ocean currents sucking heat out of the atmosphere in quantities significantly larger than before. (9) It is also hidden in polar regions where warming is double to triple the average global rate. (10)
The reason warming is hidden at the poles is that there are very few weather stations in the polar regions. The dearth of weather information from polar regions is so large that the United Kingdom’s national meteorological organization (UK Met Office) completely ignores the polar regions when evaluating global temperature, or at least they did until recently.
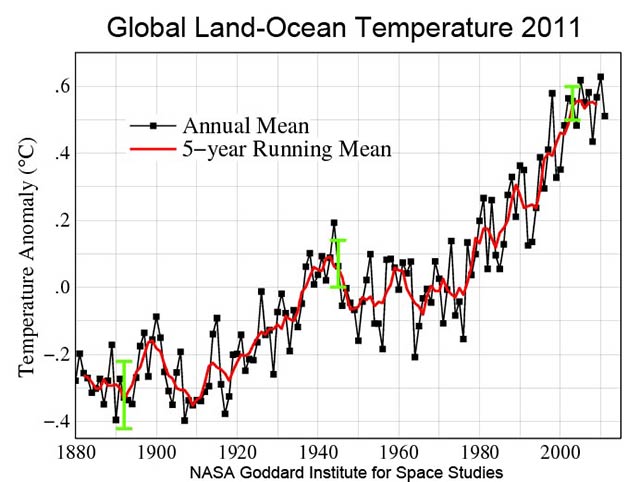
The US climate modeling agency, NASA’s Goddard Institute for Space Studies (GISS), has now begun to use the techniques that the most recent climate science suggests are appropriate for estimating polar temperature. The result is that almost all semblances of a “pause” in global warming have now been erased from GISS records as shown in the graphic “Global Land-Ocean Temperature 2014.”
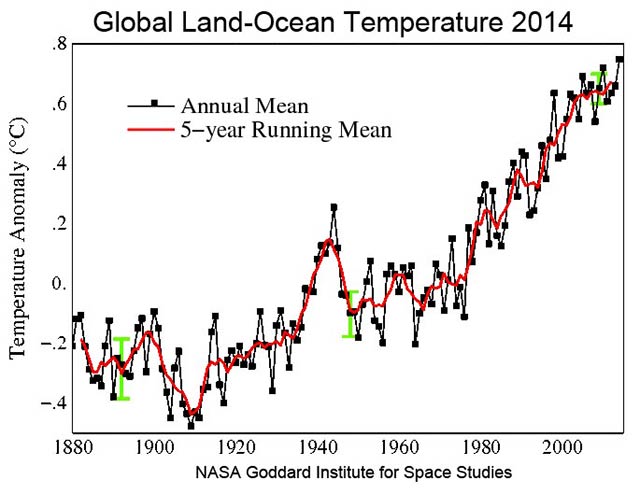 Looking carefully at the difference between the 2011 land-ocean temperature and that from 2014 reveals changes. Beginning in the late 1990s, polar regions started to warm rapidly. Because weather records in polar regions are so sparse, this warming was poorly reflected in the average global temperature. The latest research has updated techniques used for estimating polar warming and since the late 1990s, the record reflects more warming in the global average.
Some bias still exists in the temperature record, however, and this is being caused by a tremendous increase in the emissions of global cooling pollutants from developing nations. The global cooling pollutants are the same pollutants that the United States and Europe began to regulate in the 1970s.
Looking carefully at the global land-ocean temperature records, it easy to see a pause in the warming between about 1940 and the mid-1970s. The Clean Air Act, vastly expanded by President Richard Nixon in 1970, cleaned up a great deal of these smog pollutants and unmasked warming that was there all along. (11)
These global cooling pollutants are mostly sulfate aerosols, or the basic ingredients in smog emitted mostly from coal-fired power plants. The Intergovernmental Panel on Climate Change summary of recent climate research shows that 57 percent of warming that should have occurred already has been masked by these global cooling pollutants emitted at the same time carbon dioxide is emitted from burning coal. (12)
Even more warming exists than the thermometer record shows, but it has been masked by global cooling pollutants and buried in the oceans.
The final reason that Godzilla Niño and the Blob have defeated hiatus is a very simple piece of logic that has nothing to do with oceans or climate science. The mastermind deniers leading the climate change counter-movement have played a trick on us.
They say the temperature hasn’t warmed since the 1998 Super El Niño. It fools us because their voices are very authoritative, or their counsel is broadcast by voices that are very authoritative.
But their counsel is based on flawed statistical techniques. The climate change counter-movement think tanks and policy institutes chose the Super El Niño of 1998 as the starting point for their temperature pause purposefully. This is bold-faced cherry-picking.
The warmth from 1998 was aberrant. It broke all kinds of records. One cannot begin a trend evaluation with a radically aberrant starting point.
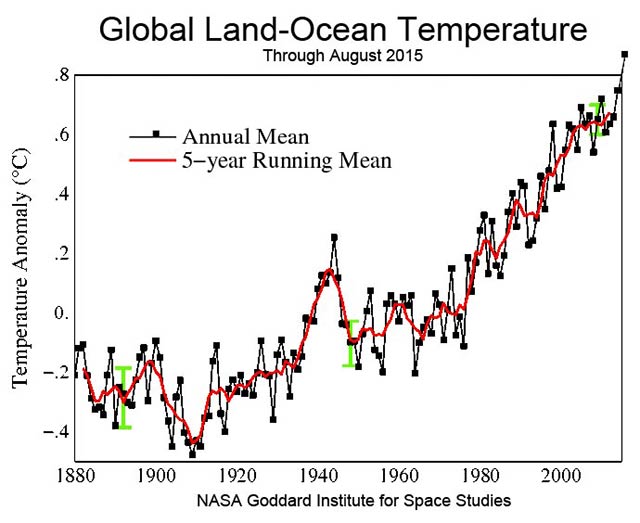 One does not have to look too closely at this graphic to see that 2015 data to date has seen the warming hiatus defeated once and for all.
The Future
In the future, what can we expect from Godzilla and the Blob? More mayhem, of course. Godzilla? The Blob? Let me end on an encouraging suggestion. The same people that bring us the climate change counter-movement, literally, also brought us the smoking debate, the acid rain debate and the ozone-depleting chemical debate. (13)
Their propaganda is so strong that even our environmental advocates cannot trust the results of research into atmospheric capture of carbon dioxide. The climate change counter-movement says the solutions to climate pollution will destroy our nations’ economies. Climate scientists say nothing of the sort.
Today, using existing technologies we can remove 50 parts per million of carbon dioxide from our atmosphere and literally end the climate pollution problem for $21 trillion. This is how much the United States spent on health care and the military from 2000 to 2009. (14)
New, field-proven technologies, now at $200 per ton, once fully industrialized, will remove the same 50 parts per million of carbon dioxide for $20 per ton or less. This is a relatively tiny $2.1 trillion. (15)
The United States spends $2.9 trillion per year on health care. Across the globe, we spend $500 billion a year on advertising. The costs to treat climate pollution are almost insignificant. In the United States, we lose $500 billion per year to sick days. We spent $2.9 trillion across the globe on life insurance premiums in 2012. We spent $479 billion on entertainment in the United States in 2012, and not including damages from climate-change-related weather events, every year in the United States, we lose $500 billion to weather-related damages. (16) Please tell your friends.
Footnotes:
1. Godzilla El Niño… NASA climatologist Bill Patzert coined the term Godzilla Niño in a San Jose Mercury News story on May 8. He didn’t say it was a Godzilla yet, but that it could become one. More recent publishing in the Los Angeles Times quotes Patzert: “This definitely has the potential of being the Godzilla El Niño.”
Rogers, California drought: El Niño probability raised to 78 percent for next winter, San Jose Mercury News, May 8, 2015.
https://www.mercurynews.com/science/ci_25723802/california-drought-el-ni-241-o-probability-raised
Lin, Latest forecast suggests ‘Godzilla El Niño’ may be coming to California, Los Angeles Times, August 13, 2015.
https://www.latimes.com/local/lanow/la-me-ln-el-Niño-20150813-htmlstory.html
2. NOAA Niño Forecast Discussion: September 10, 2015…https://www.cpc.ncep.noaa.gov/products/analysis_monitoring/enso_advisory/ensodisc.pdf
3. The Blob… Nick Bond of the Joint Institute for the Study of the Atmosphere and Ocean at the University of Washington coined the term “the Blob” for the unusual shallow layer of very warm ocean water across much of the North Pacific. During the negative phase of the PDO, most of the North Pacific is cool, except for the far eastern areas along North America where it is warmer than normal. During the positive phase, the North Pacific is mostly warm, except for cooler than normal along the coast of North America. The “uncharacteristic” part of Nicholas Bond’s statement speaks to above normal temperatures extending across the entire North Pacific, with no demarcation of warmer and cooler than average waters as is usually the case in either the positive or negative phases of the PDO.
Milstein, Unusual North Pacific warmth jostles marine food chain, Office of the Washington State Climatologists newsletter, June 3, 2014. https://www.climate.washington.edu/newsletter/2014Jun.pdf
4. “This is a taste of what the ocean will be like in future decades”… Bond is quoted in the University of Washington Today. Recent research has likely found a cause for the Blob. It is related to Omega blocking in the northeast Pacific, likely caused by Arctic Amplification (see here: Melton, Arctic Warming and Increased Weather Extremes, Truthout.org, July 15, 2014. https://truthout.org/news/item/24485-arctic-warming-and-increased-weather-extremes-the-national-research-council-speaks) A persistent area of high pressure, caught between loops of the jet stream in a process called Omega blocking, has caused weaker winds in the northeastern Pacific recently. The weaker winds allow less ocean water cooling in winter and the warmer water has persisted.
Hickey, ‘Warm blob’ in Pacific Ocean linked to weird weather across the US, University of Washington Today, April 9, 2015, final paragraph. https://www.washington.edu/news/2015/04/09/warm-blob-in-pacific-ocean-linked-to-weird-weather-across-the-u-s/
5. The PDO enhances both El Niño and La Niña in North America… A positive PDO, with a warm far-Eastern Pacific, enhances El Niño weather impacts in North America and a negative PDO with below average North Pacific surface temperatures near North America enhances impacts of La Niña in North America.
Gershunov et al., North Pacific interdecadal oscillation seen as factor in ENSO-related North American climate anomalies, EOS, American Geophysical Union, January 19, 1999, last paragraph, page 2. https://onlinelibrary.wiley.com/doi/10.1029/99EO00019/epdf
6. This could be a switch to the positive phase of the PDO or something related to El Niño… Toby Garfield, director of the Environmental Research Division at the Southwest Fisheries Science Center.
Milstein, Unusual North Pacific warmth jostles marine food chain, Office of the Washington State Climatologists newsletter, June 3, 2014. https://www.climate.washington.edu/newsletter/2014Jun.pdf
7. The PDO and El Niño reduce global warming in their cool phases and enhance it in their warm phases…
Trenberth and Fasullo, An apparent hiatus in global warming – question mark, Earth’s Future, American Geophysical Union, December 5, 2013, page 22, second paragraph. https://www.cgd.ucar.edu/cas/Trenberth/website-archive/trenberth.papers-moved/T-F_Hiatus_Earth’sFuture13a.pdf
Also: The PDO is referred to by another of its names in Maher – the Interdecadal Pacific Oscillation (IPO).
Maher et al., Drivers of decadal hiatus periods in the 20th and 21st centuries, Geophysical Research Letters, August 2014, abstract. https://web.science.unsw.edu.au/~matthew/Maher_et_al_2014_GRL_incl_cover.pdf
8. $900 million per year climate change counter-movement… From 2003 to 2010, $7 billion in climate change counter-movement funding has been identified from revenues reported in IRS tax returns for 91 of 118 organizations and institutions identified in the academic literature as being involved.
Brulle, Institutionalizing delay: foundation funding and the creation of US climate change counter-movement organizations, Climatic Change, December 21, 2013. https://www.drexel.edu/~/media/Files/now/pdfs/Institutionalizing%20Delay%20-%20Climatic%20Change.ashx
9. More heat going into the oceans… The upper 700 meters of ocean shows a systematic low bias because of sparse monitoring in the southern oceans since 1970, meaning that much larger amounts of heat are going into the upper oceans than previously understood.
Durak et al., Quantifying underestimates of long-term upper ocean warming, Nature Climate Change, October 5, 2014, abstract. https://www-pcmdi.llnl.gov/about/staff/Durack/dump/oceanwarming/141130a_Duracketal_UpperOceanWarming.pdf
Also, more heat going into the middle layers of the oceans… Before 2006, intermediate depths between 700 and 1,500 meters were not warming. This research shows warming in intermediate depths is now nearly half of the warming in surface waters and surface water warming has remained steady.
Roemmich et al., Unabated planetary warming and its ocean structure since 2006, Nature Climate Change, February 2, 2015, abstract. https://www.nature.com/nclimate/journal/v5/n3/full/nclimate2513.html
10. Warming hidden in the Arctic bias… A dearth of weather reporting stations in the Arctic has created a cold biased temperature record. New statistical techniques have introduced greater accuracy in global temperature sets with the UK Met temperature set responding to a greater degree than the rest. The UK Met formerly ignored polar temperatures because of their scarcity and (at the time) poor level of robustness.
Cowtan and Way, Coverage bias in the HadCRUT4 temperature series and its impact on recent temperature trends, Quarterly Journal of the Royal Meteorological Society, November 2013, Abstract, last paragraph. https://onlinelibrary.wiley.com/doi/10.1002/qj.2297/epdf
11. Air pollution caused global cooling between 1940 and the 1970s… Wilcox et al., The influence of anthropogenic aerosols on multi-decadal variations of historical climate, Environmental Research Letters, June 5, 2013, abstract: https://iopscience.iop.org/1748-9326/8/2/024033/pdf/1748-9326_8_2_024033.pdf
Press release: https://phys.org/news/2012-04-term-north-atlantic-surface-temperature.html
12. IPCC 57 Percent of warming already masked by smog… Up to (-)1.9 to (-) 0.1Wm(-2) of warming has been masked by aerosols out of 2.29 Wm(-2) of total warming experienced to date. This equals 57 percent of total warming masked by aerosols and does represent the high end of the range. The high end of the range is unfortunately, a likely scenario for the future as greenhouse gas emissions are trending or above the IPCC 2007 worst-case scenario.
IPCC 2013 Summary for Policy Makers (SPM), page 13, C. Drivers of Climate Change, bullet 7. https://www.climatechange2013.org/images/uploads/WGI_AR5_SPM_brochure.pdf
13. Smoking Debate, Acid Rain Debate and the Ozone Depleting Chemical Debate… The most definitive reference on the subject is a highly referenced book by statistician Naomi Oreskes.
Oreskes and Conway, Merchants of Doubt, Westchester Book Group 2011. https://www.merchantsofdoubt.org/
14. 50 parts per million of carbon dioxide for $21 trillion using existing technologies… From Hansen 2008, Target Atmospheric carbon dioxide, Where should humanity aim? “(The) Desire to reduce airborne carbon dioxide raises the question of whether carbon dioxide could be drawn from the air artificially. There are no large-scale technologies for carbon dioxide air capture now, but with strong research and development support and industrial scale pilot projects sustained over decades it may be possible to achieve costs ~$200/tC [81] or perhaps less [82]. At $200/tC, the cost of removing 50 parts per million of carbon dioxide is ~$20 trillion.”
Hansen et al., Target Atmospheric carbon dioxide Where Should Humanity Aim? Open Atmospheric Science Journal, November 2008, page 226 and 227, Section 4.4 Policy Relevance, page 227, paragraph 1.
https://pubs.giss.nasa.gov/docs/2008/2008_Hansen_etal_1.pdf
15. Atmospheric capture of carbon dioxide… Goepert et al. produced a summary of research on the subject.
$20 per ton (just over) capture and storage… Section 5.1 paragraph 2, “The technology developed by Steinberg and co-workers and CoAway LLC using the K2CO3/KHCO3 cycle is described as being able to capture carbon dioxide from air for less than $20 per ton. The total cost including sub-surface injection was estimated to be slightly above $20 per ton.”
$49 to $80 per ton… Section 5.1 paragraph 3: “An air capture system designed by Keith et al. using a Na/Ca cycle was estimated to cost approximately $500 per ton C ($140 per ton carbon dioxide). The authors added that about a third of this cost was related to capital and maintenance cost. Further development and optimization of the system by Carbon Engineering Ltd. for the effective extraction of carbon dioxide from air resulted in the decrease of the estimated cost to $49-80 per tonne carbon dioxide.”
$30 per ton long term… Section 5.1, paragraph 5: “Lackner and co-workers developed an anionic exchange resin able to release carbon dioxide in a moisture swing process. The cost of only the energy required per ton of carbon dioxide collected was around $15. The initial cost of air capture including manufacturing and maintenance can be estimated at about $200 per ton of carbon dioxide. However, this cost is expected to drop considerably as more collectors are built, possibly putting carbon dioxide capture in the $30 per ton range in the long term.”
Goeppert et al., Air as the renewable carbon source of the future – carbon dioxide Capture from the atmosphere, Energy and Environmental Science, May 1, 2012.
Abstract only: https://pubs.rsc.org/en/Content/ArticleLanding/2012/EE/c2ee21586a#!divAbstract
Lackner’s testimony to Congress: Cost of Air Capture: $200 per ton initially, $30 per ton fully industrialized… Testimony to the Science, Space and Technology Committee chaired by Lamar Smith, 020410, page 5 first paragraph. https://science.house.gov/sites/republicans.science.house.gov/files/documents/hearings/020410_Lackner.pdf
The myth of the costs of atmospheric removal being exorbitant… This myth comes from an evaluation of existing atmospheric removal techniques done by the American Physical Society. This work did not evaluate new technologies currently in the developing and field trial stages. The climate change counter-movement picked up the APS study and ran. They have been grandstanding this study as proving the infeasibility of atmospheric capture ever since. The media penetration is so deep that most environmental advocates believe them, both amateur and professional alike. Two days after the APS press release for this work, one of the two or three most prestigious scientific journals in the world (Nature) rebutted the APS work and its relevance to current science.
American Physical Society Study:
Direct Air Capture of carbon dioxide with Chemicals, The American Physical Society, June 2011.
https://www.aps.org/policy/reports/assessments/upload/dac2011.pdf
APS Press Release May 9, 2011: https://www.aps.org/about/pressreleases/dac11.cfm
Evaluation of APS study by Nature: Van Norden, Sucking carbon dioxide from air too costly, say physicists, Nature May 11, 2011. https://blogs.nature.com/news/2011/05/sucking_carbon_dioxide_from_ai.html
16. US Health Care Expenditures in 2013 were $2.9 trillion… National Health Expenditures 2013 Highlights, Centers for Medicare and Medicaid Services, CMS.gov. https://www.cms.gov/research-statistics-data-and-systems/statistics-trends-and-reports/nationalhealthexpenddata/downloads/highlights.pdf
Advertising: We spend $500 billion every year on advertising across the globe… eMarketter, Asia-Pacific Poised to Dominate North America as World’s Top Ad Market, According to ‘Most Comprehensive’ Edition of the eMarketer Global Media Intelligence Report, October 10, 2012, Chart: Total Media Ad Spending Worldwide by Region. $504 billion spent globally on total media ad spending in 2011, $572 projected in 2013.
https://www.emarketer.com/newsroom/index.php/asiapacific-poised-dominate-north-america-worlds-top-ad-market-comprehensive-edition-emarketer-global-media-intelligence-report/
Sick Days: We spend $576 billion every year in the US on the costs of being sick at work…This includes incidental absence due to illness, workers comp, short-term disability, long term disability; treatments at the doctor’s office and pharmacy, lost productivity and reduced performance. This is according to the Integrated Business Institute’s Full cost estimator.
Press Release: https://www.prnewswire.com/news-releases/poor-health-costs-us-economy-576-billion-according-to-the-integrated-benefits-institute-169460116.html
$2.6 trillion in global life insurance premiums in 2012…https://www.firstresearch.com/Industry-Research/Life-Insurance-Carriers.html
$479 billion in entertainment in the US in 2012… The Price Warehouse Coopers Global Entertainment and Media Outlook: 2013-2017 tells us: The US entertainment and media market generated $479.23 billion in 2012, representing 29.2 percent of the worldwide revenue of nearly $1.639 trillion. In 2017, the US is expected to account for $632.09 billion, or 29.4 percent of the worldwide total of more than $2.152 trillion https://www.hollywoodreporter.com/news/study-global-media-industry-poised-562694
An important fundraising appeal: We fell short of our goal
Thank you for reading Truthout today. We have a brief message before you go.
Unfortunately, donations are down for Truthout at a time when media faces immense pressure. Yet, grassroots media is vital in the fight against Trump’s authoritarian reign. Our mandate to tell the truth, share strategies for resistance, and speak against fascism grows more urgent each day. We must appeal for your support.
If you can support Truthout with a one-time or monthly donation, you will make a significant impact on our work. Please give today.