
“The best estimate of the human-induced contribution to warming is similar to the observed warming [from 1951 through 2010].” IPCC 2013, Summary for Policy Makers.(1) This statement differs radically from the almost ubiquitous understanding that part of global warming has been caused by humanity and part is natural. In reality however, humanity’s excess greenhouse gas emissions have caused about 35 percent more than all of the observed warming and our climate is naturally cooling – there is no natural warming. Therein lies the rub. How can the human-induced contribution be similar to observed warming if more than all of the warming has been caused by humanity?
The answer is complicated, and is in part responsible for the miscommunication all these years. But first, what’s all of this about part of the warming being natural?
It is common knowledge that some portion of global warming is a natural phenomenon. Many reasons can be identified to show why we understand global warming this way and they include: partial knowledge about warming and cooling pollutants and mechanisms in the past, poor communication technique from scientists and anti-climate science propaganda from the climate change counter-movement (vested interests, fossil fuel industrial complex, Conservative think tanks and politicians, etc.)(2)
Starting From the Beginning: Ongoing Natural Global Cooling
Earth’s orbit around the sun and its tilt relative to the sun goes through cycles that range up to 100,000 years. These cycles result in 100,000 year–long ice ages alternating with 10,000 year-long interglacial warm periods (approximately). Our last ice age ended about 10,000 years ago and according to orbital cycles theory, we should have started cooling many thousands of years ago as we move into our next ice age.
Humanity began changing Earth’s climate 8,000 years ago because of the invention of agriculture.
Milutin Milankovitch first popularized the mechanics of this ice age theory during the First World War, but his theory was a bit flawed. Orbital cycles initiate ice ages; they don’t cause them. Feedbacks are responsible for most of the temperature change (changes in vegetation cover and resulting CO2 and methane changes, as well as changes in snow and ice cover, atmospheric and soil moisture and other natural earth processes). This flaw in Milankovitch’s theory however, does not mean that Ice Age Theory is wrong.
The Invention of Agriculture: Why Warming Instead of Cooling
Common wisdom is that human-caused warming began with the Industrial Revolution in the 18th century. In 2003, William Ruddiman, from the Department of Environmental Sciences, University of Virginia and Professor Emeritus from Columbia University, showed how humanity began changing Earth’s climate 8,000 years ago because of the invention of agriculture.(3)
This is no casual paper on climate change. The number of this paper’s citations ranks in the top two percent of all papers ever published.(4) But do the public, our leaders and environment leaders, and even our most prestigious environmental regulatory agencies understand that this knowledge exists? Part of warming is not caused by humanity, so the rest is natural, right?
Humanity has caused some 35 percent more warming than is evident in the temperature record.
Ruddiman’s hypothesis continues; about 5,000 years ago, humanity upped the ante a notch and began growing rice for a very large portion of our population. Rice not only takes up area that forest once grew, but it creates methane too, a greenhouse gas 25 times more powerful than carbon dioxide in the long term.
Calculations by Ruddiman show that cooling from orbital cycle changes and consequential feedbacks should have cooled Earth 0.8 degrees C (1.4 degrees F) by 1800 AD. This exactly coincides with how much Earth has warmed in this period.
Although the cooling that we should have experienced in the last 200 years is less than 0.1 degrees F, the point is that there is no natural warming going on, the natural trend is a cooling trend.
More Than Observed Warming?
In and of itself, the IPCC Summary for Policy Makers statement above, “The best estimate of the human-induced contribution to warming is similar to the observed warming,” is seemingly straightforward and definitive. But it’s not. Humanity has caused some 35 percent more warming than is evident in the temperature record.
This is how observed warming can be less than what our greenhouse gas emissions have caused: some of our climate pollution emissions are global cooling emissions.
It literally took me a year to figure this one out. I’ll admit that I am not the sharpest knife in the drawer; it simply took me a year’s worth of fiddling to finally be able to understand the sources of these statements (Chapter 10 in the IPCC report). With this understanding in pocket, I could finally muster the courage to begin asking the lead authors questions. The need for the questions comes from a statement in IPCC’s Summary for Policy Makers (SPM) that immediately precedes the “human-induced contribution” statement. The quote below is how these two sentences are presented in Section D.3 of the SPM, Attribution of Climate Change, Bullet One:
“It is extremely likely that more than half of the observed increase in global average surface temperature from 1951 to 2010 was caused by the anthropogenic increase in greenhouse gas concentrations and other anthropogenic forcings together. The best estimate of the human-induced contribution to warming is similar to the observed warming.”
“More than half…” creates the confusion. The explanation comes from the final phrase of the first sentence, “… and other anthropogenic forcings together.” Forcings can be both warming or cooling. Cooling is caused by sulfates emitted from burning coal, volcanoes, clouds, natural ocean cycles and the 22-year sunspot cycle.
So when the IPCC says “…other anthropogenic forcings together,” this means net warming; or all of the forcings combined together. This is how observed warming can be less than what our greenhouse gas emissions have caused: some of our climate pollution emissions are global cooling emissions. In the past, the science did not portray a good understanding of a lot of these cooling and warming forcings; we only knew that our climate was naturally cooling, so warming must be more than observed. Now we have a much better understanding and can say how much warming and cooling comes from what source. It is very important that outreach and policy reflect this new knowledge.
The total warming that we should see from excess greenhouse gases that we have emitted (based on 1951 to 2010) is 0.9 degrees C, but optical aerosols and have masked about 35 percent of that.
The “human-induced contribution…” statement can also be reconciled with an understanding that it is “net” warming we are talking about.
So why the confusion? Could it be that some stop reading after such a definitive statement as “half of the warming is caused by…” and never get to the meat of the subject focused on forcings? Or could it be the $900 million annual funding for the climate change counter-movement, or simply that scientists have not felt comfortable enough with their knowledge yet to create a definitive statement such as was created in the 2013 IPCC report? All of the pieces of the puzzle have been known for over a decade. Ruddiman’s distinguished success with his 2003 paper attests to this.
Whatever the reason, the miscommunication has been so successful that even the EPA repeats the myth in a bulleted statement in an emphasis box on their Climate Change Science website: “Most of the observed warming since the mid-20th century is due to human-caused greenhouse gas emissions.”(5)
The rest must be caused naturally, shouldn’t it?
Warming and Cooling Balance Sheet
The IPCC sums up all the different forcings and emissions and mechanisms involved in this nifty little chart from their Technical Summary and from Chapter 10 and it is presented below in the chart: Global Temperature Change 1951 to 2010 Balance Sheet. The chart begins only at 1951 because data prior to then are not as robust as later data, though it is quite likely that current trends are not markedly different from prior ones.
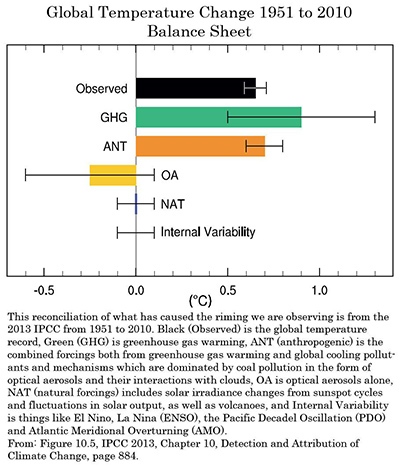 One word about errors: The “whiskers” or the horizontal lines with small perpendicular lines on each end that look like a very wide letter “H” are part of what is called a box plot. The whiskers represent the rare outliers of the data set or the distribution of data points. So looking at “Observed,” warming is (about) 0.65 degrees C, with a maximum outlier of 0.71 C and a minimum outlier of 0.58 C. When looking at the statistics of a data set and their relationship to the whiskers, the most of the data points are very close to the middle of the whiskers or 0.65 degrees. I have left the whiskers on this plot to make a point. Many see these “error bars” incorrectly and assume that the answer lies anywhere between the error bars. Although not invalid, a more accurate interpretation of error bars is that, only on rare occasions is the answer not very close to the middle of the whiskers.
On the balance sheet: “observed” in black, is warming we have seen in the thermometer record from 1951 to 2010 at about 0.65 degrees C. “GHG” in green, is warming from greenhouse gases at 0.9 C. This is the “forcing,” or how much our atmosphere should have warmed without interference from any other source. “ANT” in orange, is anthropogenic forcing at 0.7 C, or the net warming from all sources both warming and cooling. “OA” in yellow is optical aerosols, of about -0.25 C. Optical aerosols are mostly sulfate pollution from burning coal and they are global cooling pollutants and will be discussed further in a few paragraphs. “NAT” in blue, is natural forcing from things like changes in the sun’s energy, mostly from the sunspot cycle as well as changes in natural forcings from volcanoes. “Internal Variability” of about plus or minus 0.01 C comes from natural earth system cycles which are mostly ocean cycles like El Nino, La Nina, the Pacific Decadel Oscillation and the Atlantic Meridional Overturning; and the amount is too small to register on this chart.
Observed warming and anthropogenic warming (ANT) should be equal, but because they were determined using different methods (thermometers versus calculations) and because of the error bars in the different mechanism that warm and cool, there is a small mismatch of about 0.05 C or less than 10 percent. This is pretty good since there are so many individual mechanisms and they all have their own error bars.
To summarize, the total warming that we should see from excess greenhouse gases that we have emitted (based on 1951 to 2010) is 0.9 degrees C, but optical aerosols and have masked about 35 percent of that.
Optical Aerosols: Smog From Coal
Now we turn to the main reason why human-induced warming is more than observed warming. The IPCC says approximately 57 percent of warming that should have already occurred has come from optical aerosols or global cooling sulfates, mostly emitted from burning coal.(6)
Emissions reductions timing is paramount.
These sulfate emissions are much more commonly known as one of the main ingredients in smog. In the post-World War II era, rapid industrial expansion emitted so many global cooling sulfates that smog cooled Earth enough to actually stall warming. By the mid-1960s, smog was crippling major population centers in the developed world. In 1963, the US enacted the Clean Air Act, but it was not until 1970 that President Nixon put teeth into the rules. At about the same time, most of the rest of the developed world did the same. In the US, about half of coal fired generators have sulfate scrubbers and these remove about half of the sulfate from the exhaust stream.(7)
Because sulfates are very short-lived pollutants, by the late 1970s, the masking of global warming that they had been creating disappeared and the global temperature started to rise again.(8)
The Moral to This Story: Emissions Reductions Timing
Since about 2000, Eastern Nations (China and India, etc.) have seen a very rapid industrialization without the benefit of air pollution control rules. The IPCC statement that 57 percent of warming that should have already occurred is significantly caused by this new phase of air pollution from Eastern Nations.
These nations are currently suffering extreme air pollution in many heavily populated regions and are in the beginning stages of regulation. As these regulations evolve and as sulfates are regulated more stringently, warming from greenhouse gases already emitted will be unmasked. Combining this unmasking with the current rapidly increasing rate of greenhouse gas emissions means the global temperature will climb at a rate that will make the increase from 1951 to 2010 pale in comparison.
Hidden in this masking, and in the current state of climate pollution control policy, is an unseen and very counter-intuitive reality. Climate pollution policy is no longer about reducing carbon dioxide as fast as possible. Emissions reductions timing is paramount. Without understanding the net impact of all air pollutants – warming and cooling – emitted from coal, using the almost universally proposed method of shutting down coal generation as a primary climate change policy measure, it is entirely possible that we could actually see more warming than if we did nothing at all.(9)
References:
1. IPCC: More than all of observed warming and half of warming explained… Bullet one, Summary for Policy Makers, Section D.3, Attribution of Climate Change, page 15: “It is extremely likely that more than half of the observed increase in global average surface temperature from 1951 to 2010 was caused by the anthropogenic increase in greenhouse gas concentrations and other anthropogenic forcings together. The best estimate of the human-induced contribution to warming is similar to the observed warming over this period.” The key is in the last phrase of the first sentence “Anthropogenic forcings together.” Forcings include both warming and cooling forcings. Because 57 percent of warming that should have occurred already has been masked by global cooling sulfates, mostly emitted from burning coal, total “forcings” are less than total warming.
2. Climate Change Counter-Movement… Brulle, Institutionalizing delay: foundation funding and the creation of U.S. climate change counter-movement organizations, Climatic Change, December 21, 2013.
3. Our climate should be cooling, not warming… From the abstract of Ruddiman 2003: “The anthropogenic era is generally thought to have begun 150 to 200 years ago, when the industrial revolution began producing CO2 and CH4 at rates sufficient to alter their compositions in the atmosphere. A different hypothesis is posed here: anthropogenic emissions of these gases first altered atmospheric concentrations thousands of years ago. This hypothesis is based on three arguments. (1) Cyclic variations in CO2 and CH4 driven by Earth-orbital changes during the last 350,000 years predict decreases throughout the Holocene, but the CO2 trend began an anomalous increase 8000 years ago, and the CH4 trend did so 5000 years ago. (2) Published explanations for these mid- to late-Holocene gas increases based on natural forcing can be rejected based on paleoclimatic evidence. (3) A wide array of archeological, cultural, historical and geologic evidence points to viable explanations tied to anthropogenic changes resulting from early agriculture in Eurasia, including the start of forest clearance by 8000 years ago and of rice irrigation by 5000 years ago.”
Ruddiman, The Anthropogenic Greenhouse Era Began Thousands of Years Ago, Climatic Change, December 2003. (574 scientific research articles cite Ruddiman 2003 as of 04/02/2015.)
4. Ruddiman’s paper ranks in the top two percent of most highly published papers of any kind, in all time… 826 citations according to Google Scholar, ISI has 410, 439 on ResearchGate, … The bottom 56 million papers have less than 100 citations each. The top one million papers have between 100 and 999 citations. 25 million have zero citations each.
Noorden, Maher and Nuzzo, The top 100 papers, nature explores the most-cited research of all time, Nature, October 29, 2014,. See the image “The Paper Mountain.”
5. EPA repeats the myth that part of the warming is natural… Most of observed warming is caused by humanity’s greenhouse gas emissions… EPA, Climate Change, Science, Causes, paragraph 5.
6. IPCC 2013, Optical Aerosols mask 57 percent of warming that should already have occurred… In the Summary for Policy Makers, 57 percent of warming that should have been experienced to date has been masked by aerosols. The major driver in this masking is sulfates from burning coal. The high end of the range suggested by the IPCC has been used in this 57 percent estimate because of the history of underestimation by the IPCC.
IPCC 2013 Summary for Policy Makers (SPM), page 11, C. Drivers of Climate Change, bullet 7. Up to (-)1.9 to (-) 0.1Wm(-2) of warming has been masked by aerosols out of 2.29 Wm(-2) (Bullet 1) of total warming experienced to date. This equals 57 percent of total warming masked by aerosols and does represent the high end of the range.
7. More than half of SO2 emissions by coal… This accounting looks at data to 2005. Since 2005, Russia and India have both surpassed the U.S. in SO2 emissions because of greatly increased electrical generation from coal. Smith at al., say half of aerosol sulfate emissions are from coal generation up to 2005.
Smith et al., Anthropogenic sulfur dioxide emissions 1850 to 2005, atmospheric Chemistry and Physics, 11, 1101-1116, 2011, page 1108, Results and Discussion, paragraph 3.
8. Air pollution caused global cooling between 1940 and the 1970s: Wilcox et al., The influence of anthropogenic aerosols on multi-decadel variations of historical climate, Environmental Resaerch Letters, June 5, 2013, abstract.
9. With a 50 percent swap of coal for natural gas, warming is increased to 2050 with zero fugitive methane emissions and to 2140 with 10 percent fugitive emissions… From the abstract.
Wigley, Coal to gas: the influence of methane leakage, Climatic Change Letters, August 26, 2011, abstract, final sentence.
<!—[if gte mso 9]>
<![endif]—><!—[if gte mso 9]>
<![endif]—><!—[if gte mso 9]>
<![endif]—><!—[if gte mso 10]>
<![endif]—>
Thank you for reading Truthout. Before you leave, we must appeal for your support.
Truthout is unlike most news publications; we’re nonprofit, independent, and free of corporate funding. Because of this, we can publish the boldly honest journalism you see from us – stories about and by grassroots activists, reports from the frontlines of social movements, and unapologetic critiques of the systemic forces that shape all of our lives.
Monied interests prevent other publications from confronting the worst injustices in our world. But Truthout remains a haven for transformative journalism in pursuit of justice.
We simply cannot do this without support from our readers. At this time, we’re appealing to add 50 monthly donors in the next 2 days. If you can, please make a tax-deductible one-time or monthly gift today.