Support justice-driven, accurate and transparent news — make a quick donation to Truthout today!
Earlier this summer, when the Brennan Center released a report examining voter purge data through 2016, we found that four million more people were purged from the rolls between the federal elections of 2014 and 2016 than between 2006 and 2008. Much of that increase came from states that were previously required under the Voting Rights Act (VRA) to get election changes cleared in advance, before that part of the law was eviscerated by the Supreme Court in 2013.
Although comparable data for the two years ending in 2018 won’t be available until early next year, we were able to use different data sources to figure out how many voters have been purged over the past two years in three states we had studied — Florida, Georgia, and North Carolina. A preliminary analysis supports our initial alarm over the purge processes in these three states, showing that they continued to have high purge rates.
Purges in and of themselves aren’t bad. They’re commonly used to clean up voter lists when someone has moved, passed away, and more. But too often, names identified for removal are determined by faulty criteria that wrongly suggests a voter be deleted from the rolls. When flawed, the process threatens to silence eligible voters on Election Day — especially in states where purge rates are high.
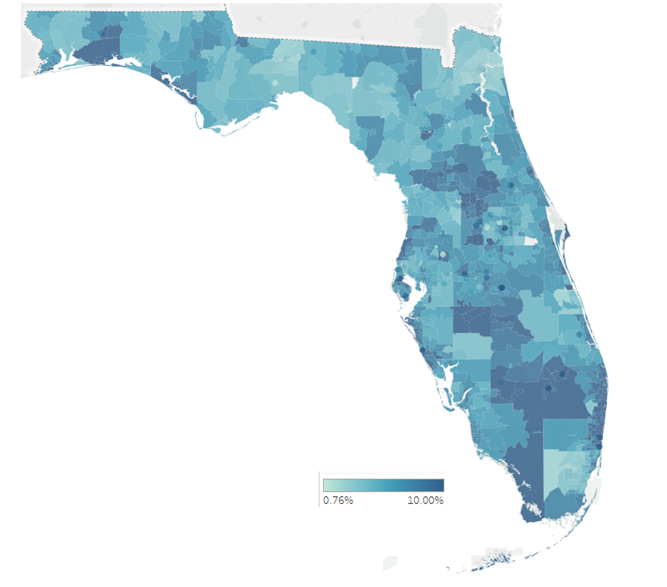
Florida
From November 2008 to November 2010, the median purge rate in the Sunshine State was 0.2 percent. That number jumped to 3.6 percent from 2012 to 2014. And new data show it’s jumped again: Between December 2016 and September 2018, Florida has purged more than 7 percent of its voters.
Not only can we tell that purges have increased — we also know where the biggest purges are happening. Hardee, Hendry, Palm Beach, and Okaloosa counties have each purged more than 10 percent of their voters in the last two years.
Dade and Broward counties also have a number of zip codes that purged at higher rates. Some of those zip codes, however, include military bases or college campuses, which one would expect to have higher purge rates because of the transient nature of the population and the established processes for removing voters who have moved.
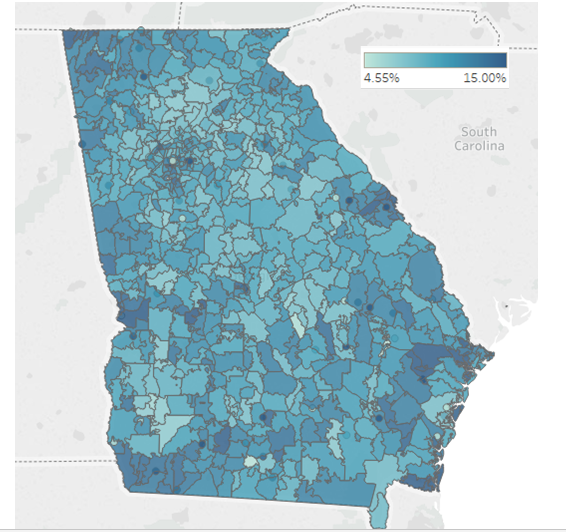
Georgia
Between 2010 and 2014 — a period of time that covers before and after the Supreme Court’s decision on the Voting Rights Act — Georgia’s median purge rate increased from 6.7 percent to 10.7 percent. Our analysis of the data shows that the state continues to have a high purge rate: Over the past two years, the state has purged 10.6 percent of voters. Nonwhite voters were slightly overrepresented among those purged when compared to the total population breakdown.
Ninety-seven of the state’s 159 counties purged more than 10 percent of their voters in the last two years. Four counties (Chattahoochee, Liberty, Dade, and Camden) are particular outliers, each purging at least 15 percent of their voters. At a more granular level, 430 of the 781 zip codes have purged more than 10 percent of their voters since 2016. This rebuts any speculation that the VRA’s preclearance provision may have blocked reasonable list maintenance practices. “Catching up” might have seemed like an excusable reason for increased rates in the first purge cycle without pre-clearance (2014-2016), but Georgia’s purge rates have not returned to pre-2013 levels in the five years since the decision was handed down.
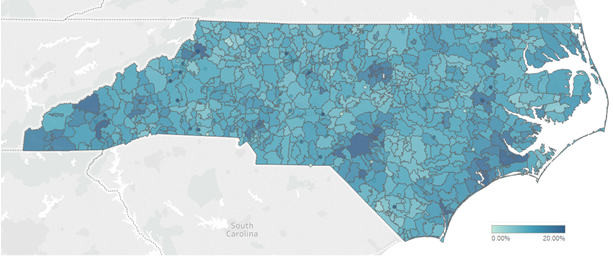
North Carolina
North Carolina’s purge rates fall in between Florida and Georgia. Forty of its one hundred counties were covered under Section V of the Voting Rights Act at the time of the Shelby County v. Holder decision in 2013. The average purge rate in the state increased modestly between 2010 to 2014, from 8.0 to 8.8 percent. Like in Georgia and Florida, however, this didn’t represent a temporary increase, but rather has been sustained over the past few years. Between September of 2016 and May of 2018 (the latest date data is available), the state purged 11.7 percent of its voter rolls. Just 19 of its counties purged fewer than 10 percent of their voters, and no county purged fewer than 8 percent. These purges have been especially troubling for voters of color – in 90 out of 100 counties, voters of color were over-represented among the purged group.
To voters living in these three states – and to voters around the country: Check your registration status to make sure that you’re still on the rolls. If you are not registered, and think you should be, call your local election official and find out why. There is still time to register in many states if you have a problem.
*Correction: This post originally said Harris County, Florida was one of the counties that had purged more than ten percent of its voters. In fact, it was Hardee County. There is no Harris County in Florida.
An important fundraising appeal: We fell short of our goal
Thank you for reading Truthout today. We have a brief message before you go.
Unfortunately, donations are down for Truthout at a time when media faces immense pressure. Yet, grassroots media is vital in the fight against Trump’s authoritarian reign. Our mandate to tell the truth, share strategies for resistance, and speak against fascism grows more urgent each day. We must appeal for your support.
If you can support Truthout with a one-time or monthly donation, you will make a significant impact on our work. Please give today.