Truthout is a vital news source and a living history of political struggle. If you think our work is valuable, support us with a donation of any size.
How do you best measure a decade, and what do you measure if you do?
With the close of a decade, it’s invariably time to take stock of superlatives: best-selling artists, worst fashion trends, brightest ideas and lowest political moments.
But how do you measure the whole decade itself? (Measurements suggesting, in the Miller-McCune spirit, that there’s a way to do this empirically.) How do you measure where we stand today compared to 10 years ago and whether that spot constitutes progress, regression or something in between? And what does a decade look like, assuming we could convert trends and sentiment into statistics and plot the whole era on a visual aid?
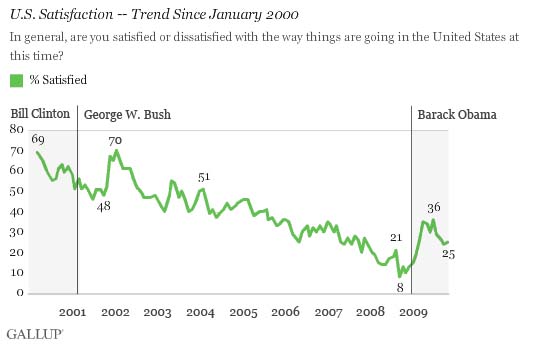
One recurring theme is that these last 10 years look a lot like this:

That chart comes from a Gallup poll that has tracked over the years responses to the question, “In general, are you satisfied or dissatisfied with the way things are going in the United States at this time?”
As recently as October 2008, only 8 percent of us were satisfied, down from 69 percent at the beginning of the decade, which says more than a commemorative New York Times compendium could about what happened in the intervening years.
Not surprisingly, this Gallup chart of how happy Americans have been with their leaders has an identical lilt:

ABC news, meanwhile, tracks a similar picture in its “Consumer Comfort Index,” a more specific measurement of how confident we are parting ways with our money (as good a way to gauge American mood as there is).

All of which parallels the downward dive later this decade in any number of stock market benchmarks.
An end-of-decade assessment by the Pew Research Center levels the grimmest charge: This decade wasn’t just crummy, it rates as the worst in the last half-century. Only 27 percent of people polled felt positive about the 2000s – worse even than the 1960s (34 percent).
The people Pew queried this December must have been looking at some of these same graphics. Asked to characterize the last 10 years in a single word, respondents most commonly said “downhill.”
Also in their top 10: poor, decline, disappointing, turbulent and chaotic.
There are, of course, a couple of indexes that trend in the opposite direction, although they won’t offer anyone much solace. The price of oil and the rate of American unemployment have gone up. So, too, has another measurement by which many will judge this period: Earlier this month, the United Nations announced this decade likely will go down as the warmest on record. (Check out the mean graph this guy is holding.)
But all that’s just another way of saying “downhill.” Economist and New York Times columnist Paul Krugman offers one other perspective. The worst financial epitaph a decade can receive is not that things went downhill, but that — in a world where long-term growth is the default mode — they went nowhere. In the last decade, there was no job creation, no economic gains, no improvement for individual income-earners or homeowners. In short, he writes, “there was a whole lot of nothing going on in measures of economic progress or success.”
This past decade, he suggested, we might call the Big Zero, which is fitting for an era we could never figure out how to name anyway. However we measure the moment — whether it looks like all the measures are bad, or in the end they add up to nothing — the consensus is the same: Let’s move on.
Media that fights fascism
Truthout is funded almost entirely by readers — that’s why we can speak truth to power and cut against the mainstream narrative. But independent journalists at Truthout face mounting political repression under Trump.
We rely on your support to survive McCarthyist censorship. Please make a tax-deductible one-time or monthly donation.